Background Noise in Audio
Our new listening studio is not for listening experiences only. It provides us with a good enough space to carry out different experiments, measurements and tests. This article deals with background noise measurements of an audio system, in the hearable spectrum. Using a microphone, we measure the noise coming directly from the speaker. We are going to compare a real noise of an amplifier, once powered directly from the power grid, once using RD EMI Neutralizer power filter.
Configuration of the System and the Measurements
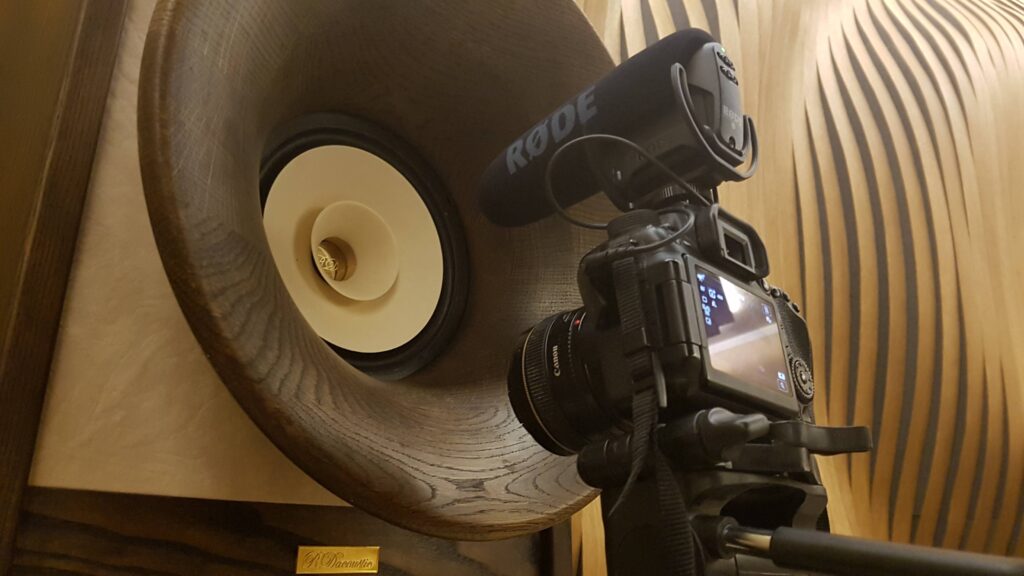
We use very high sensitivity full range speakers Evolution, a professional Rhode microphone positioned in the axis of the speaker on a tripod. The sound from the microphone is captured uncompressed using a digital camera EOS70D. The microphone is in linear mode, 0 dB gain.
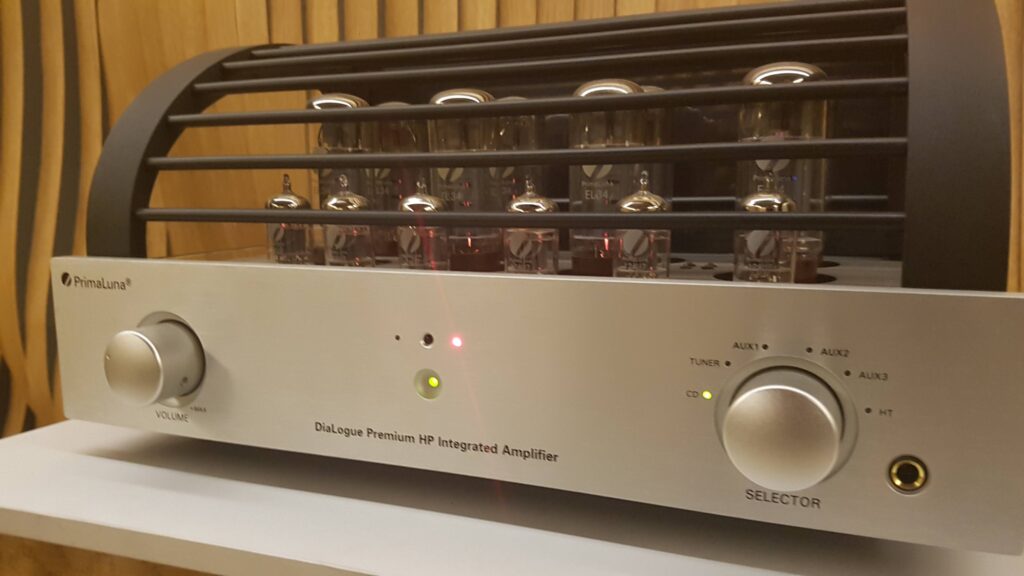
The speaker system is connected to a tube amplifier PrimaLuna Dialogue Premium HP. All its inputs are disconnected.
The measurements were taken in four different configurations:
1. Powered from the grid, volume at zero
2. Powered from the grid, volume at max
3. Powered from RD EMI Neutralizer, volume at zero
4. Powered from RD EMI Neutralizer, volume at max
Interference in the Power Grid
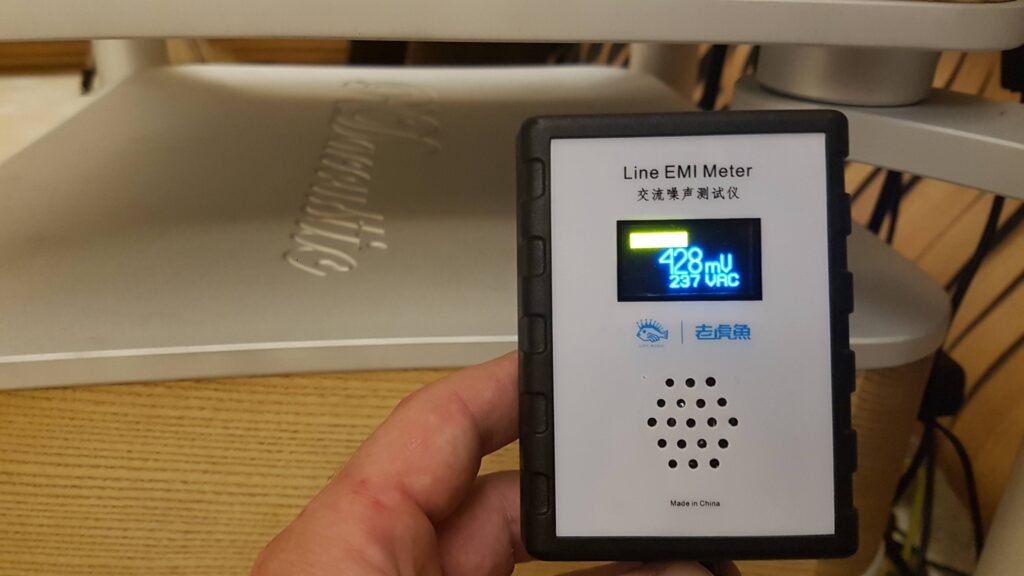
A simple EMI meter shows a relatively good value of high frequency interference in the grid: 428–430 mV. Luckily, the listening studio is far from large sources of interference. Standardly, one can meet values of 2000–4000 mV in the vicinity of inverters or industrial areas.
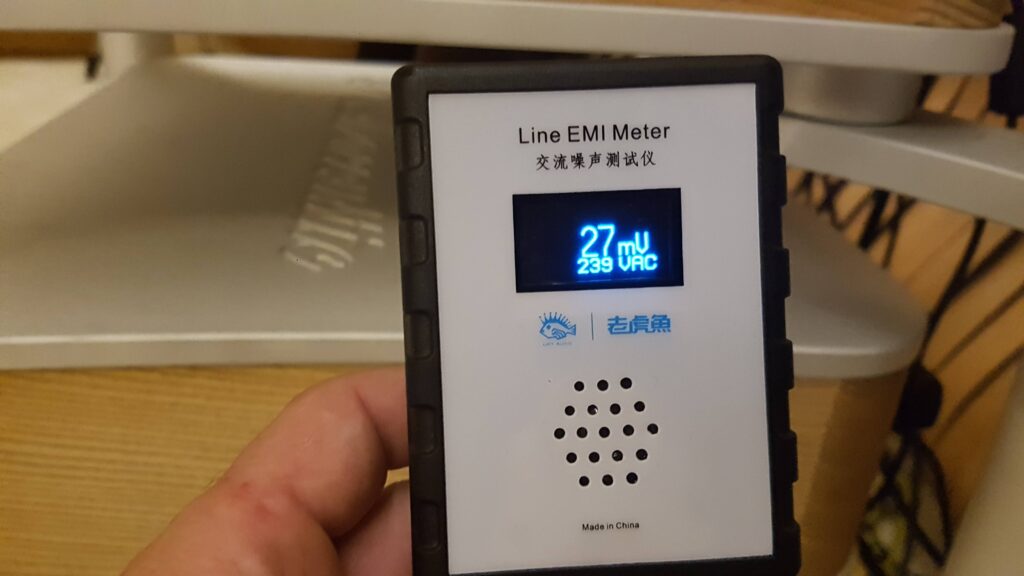
The power quality increases with RD EMI Neutralizer in the chain; the interference drops to 27 mV.
Background Noise
appears with every amplifier or audio component. Owing to the great sensitivity of the Evolutions, the noise is hearable with one’s ears, at both zero and max volumes of the amplifier.
Tentative Measurements using a Smartphone
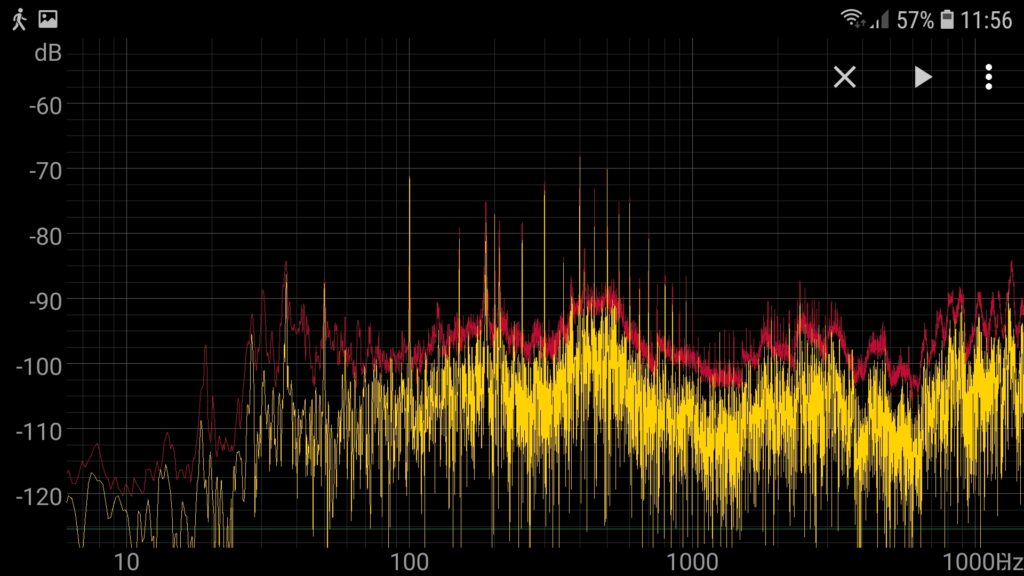
The SPECTROID app, a simple spectrum analyser, can help decode some of the basic data from the noise. I used Samsung Galaxy S7, the spectrum analyser was set as follows:
Sample frequency: 96 000 Hz
FFT resolution: 8192 samples (12 Hz)
Decimation: 6 (0.18 Hz)
Transformational interval: 50 ms
Exponential smoothing factor: 0.05
In the screenshot below, the yellow is the instantaneous value, red is the maximum. The measuring took approx. 5 seconds. Take notice of the considerably prominent peaks of grid frequency of 50 Hz and their harmonic multiples 100 Hz, 150 Hz, 200 Hz, 250 Hz, … Most likely, these are accountable to rectifier diodes used in the tube amplifier sources. Disputes regarding amplifier constructions are however not the point of this article. Every amplifier produces some inherent noise, let us look at it more closely with a more sensitive Rhode microphone.
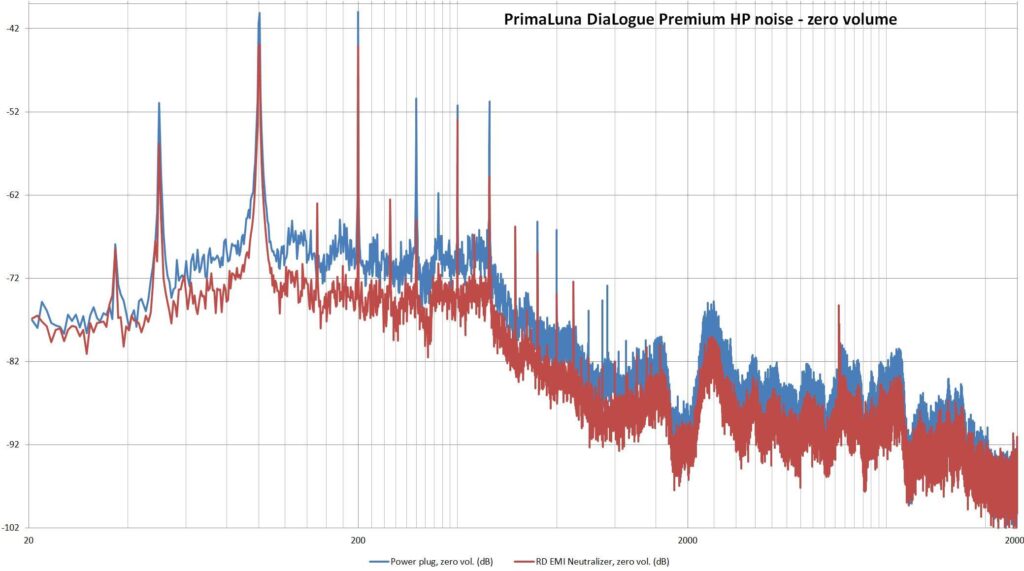
Background Noise: Zero Volume
The difference between 20 Hz to 20 kHz samples; powered directly from the grid and powered from RD EMI Neutralizer
| Arithmetic mean | 2.227138352 dB |
| Median | 2.2827415 dB |
Using RD EMI Neutralizer, the overall background noise is suppressed by more than 2.2 dB across the hearable spectrum.
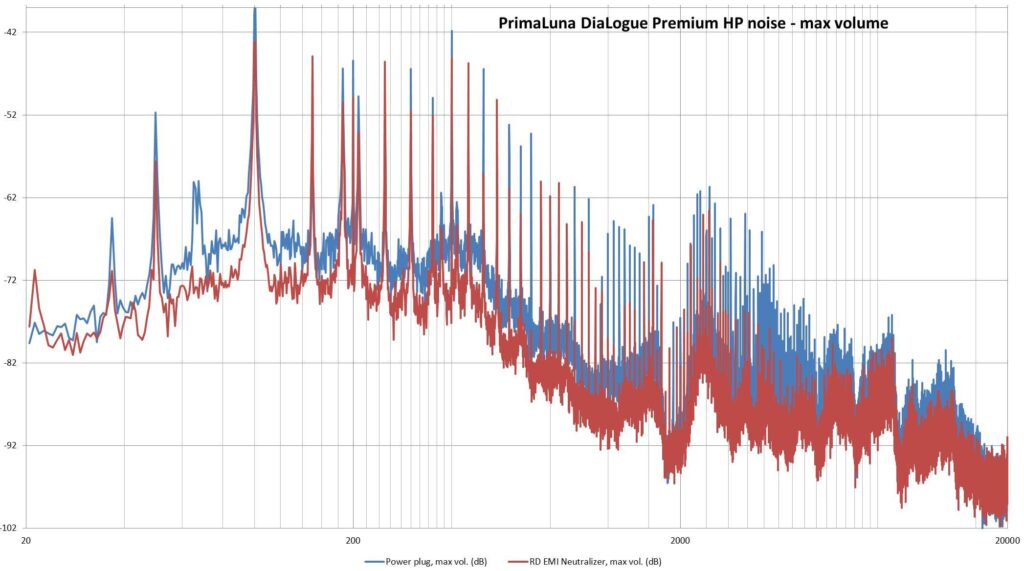
Background Noise: Max Volume
The difference between 20 Hz to 20 kHz samples; powered directly from the grid and powered from RD EMI Neutralizer
| Arithmetic mean | 2.77435877 dB |
| Median | 2.8479005 dB |
Using RD EMI Neutralizer, the overall background noise is suppressed by more than 2.7 dB across the audible spectrum.
Conclusion
Some might say “Oh, but 3 dB don’t mean anything.” We are however concerned with the smallest details that brighten the recording up, make it cleaner. The noise distance difference with RD EMI Neutralizer is hearable here and the overall dynamics of the instruments becomes more pronounced.
Newsletter
We'll let you know about our participation in audio shows, new reviews and products, new places to listen to your speakers, or new posts on our blog. We won't spam you.